


Agriculture
.jpg) Kerala, the State with network of azure backwaters, rivers and streams, boasts of an agrarian economy. The abundance of water due to the 34 lakes and other small streamlets, innumerable backwaters and water bodies and 44 rain-fed rivers flowing over the terrain of the state and also the adequate annual rainfall of 3000mm received by this state probably facilitates agriculture to a great extent and hence the economy of the state is dominated by agriculture.
Kerala, the State with network of azure backwaters, rivers and streams, boasts of an agrarian economy. The abundance of water due to the 34 lakes and other small streamlets, innumerable backwaters and water bodies and 44 rain-fed rivers flowing over the terrain of the state and also the adequate annual rainfall of 3000mm received by this state probably facilitates agriculture to a great extent and hence the economy of the state is dominated by agriculture.
Trends in Agricultural Income in Kerala:
Sl No
|
Year
|
Share of agriculture and allied sectors in GDP (India)
|
Share of Agriculture and allied sectors in GSDP (Kerala) #
|
1
|
2011-12
|
18.4
|
14.38 (9.1)
|
2
|
2012-13
|
18.0
|
13.76 (9.5)
|
3
|
2013-14*
|
18.0
|
12.9 (8.83)
|
4
|
2014-15**
|
NA
|
11.6
|
(*Provisional ** Quick # figure with 2004-05 base in brackets)
Crops
The most essential or the staple crop is the rice or paddy. About 600 varieties of rice are grown in the sprawling paddy fields of Kerala. In fact the Kuttanad region of the district of Kerala is known as the 'rice bowl of the state' and enjoys a significant status in the production of rice.
Next to rice is Tapioca and is cultivated mainly in the drier regions. Tapioca is a major food of the Keralites. Besides production of the main crop, Kerala is also a major producer of spices that form the cash crops of the state. Kerala produces 96% of the country's national output of pepper. The important spices are cardamom, cinnamon, clove, turmeric, nutmeg and vanilla.
Other cash crops that constitute the agricultural sector include tea , coffee cashew, pulses,areca nut, ginger and coconut. In fact coconut provides the principal source of income in Kerala- from coir industry to coconut shell artifacts. Cashew is also an essential cash crop. Kerala also accounts for 91% of natural rubber production of the country. Kottayam district has extensive areas producing and processing rubber. Apart from rubber, other plantation crop likes plantains or bananas are also grown in plenty.
Trend in Area, Production and Productivity of Crops and Performance :
Food grain production in country has reached a record value of 244.8 million tons in 2010-11. Production of rice alone was to the tune of 96.0 million tons in 2010-11.The estimated production of rice for the country is 102.8 million tons in 2011-12.Data regarding the area, production and productivity of important crops grown in Kerala are shown below. Out of a gross cropped area of 26.69 lakh ha. in 2009-10, food crops comprising rice, pulses and tapioca occupy only 11.74 percent. But in 2010-11, it reduced to 8.13%. Kerala state which had a low base in food production is facing serious challenges in retaining even this meager area. Kerala agricultural economy is undergoing structural transformation from the mid seventies by switching over a large proportion of its traditional crop area which was devoted to subsistence crops like rice and tapioca to more remunerative crops like banana and other plantations.
The area under rice has been declining consistently over the last several years. After a long period of continuous decline, area under paddy increased from 2.29 lakh ha in 2007-08 to 2.34 lakh ha in 2008-09 and slightly declined by 252 ha only in 2009-10. But a sharp fall of area by 20828 ha was marked during 2010-11. In the case of tapioca, the area declined from 0.75 lakh ha in 2009-10 to 0.72 lakh ha. in 2010-11. Area under cashew nut was 0.49 lakh ha in 2009-10. But it declined to 0.44 lakh ha during 2010-11.
In the case of coconut, area was at its peak during 2000-01. During the year 2010-11, the area declined by 8145 ha. Major commercial crops which had recorded reduction of area during 2010-11 are coconut (8145 ha), cardamom (351 ha), turmeric (47 ha), cashew nut (5124 ha) and tapioca (2572 ha). The major crops with considerable gain in area include pepper (693 ha), ginger (680 ha),banana (7396 ha), arecanut (646 ha), other plantains (1327 ha), coffee (135 ha), tea (120 ha) and rubber (8822 ha). The crops which have failed to sustain the production level from 2009-10 are cashew,tapioca and coconut. In 2010-11 some of the crops indicated increase in production over 2009-10. These crops are pepper (16770 MT), ginger (4594 MT), turmeric (150 MT), cardamom (135 MT), banana (77425 MT) and other plantains (15226 MT). The crops which have marked decline in the production level during 2010-11 are rice (75598 MT), pulses (482 MT), arecanut (16854 MT), cashew nut (1066MT), tapioca (165303 MT), coconut (388 million nuts) and tea (703 MT). Data regarding the area, production and productivity of important crops grown in Kerala during 2010-11 is given here.
Data regarding the area, production and productivity of important crops grown in Kerala during 2011-12 are shown here . Out of a gross cropped area of 26.6 lakh ha. In 2011-12, food crops comprising rice, pulses and tapioca occupy 10.8 percent. Kerala state which had a low base in food production is facing serious challenges in retaining even this meager area. Kerala agricultural economy is undergoing structural transformation from the mid seventies by switching over a large proportion of its traditional crop area which was devoted to subsistence crops like rice and tapioca to more remunerative crops like banana and plantations.
During 2011-12, the area under rice declined by 5027 ha. In the case of pepper, the area declined from 1.7 lakh ha in 2010-11 to 0.9 lakh ha. in 2011-12. Area under coconut was 7.7 lakh ha in 2010-11. But it increased to 8.2 lakh ha during 2011-12. All the major crops except rice and pepper showed increase in area in 2011-12. Similarly production of all major crops increased in 2011-12 except pepper. Substantial increase in production of rice is reported to the tune of 9 percent in 2011-12. In the case of coconut 12 percent increase in productivity is also reported.
Data regarding the area, production and productivity of important crops grown in Kerala during 2012-13 are shown here. Out of a gross cropped area of 25.92 lakh ha. in 2012-13, food crops comprising rice, pulses and tapioca occupy 10.4 percent. Kerala state which had
Tapioca is another important food crop of Kerala which was popularized as a cereal substitute towards the end of 19th century itself in the State. The role of cassava in the food security of the state is even more prominent today with ever declining area and production under rice. The tapioca crop occupied 12.59 per cent of the net sown area of the State in 1960-61 and the area expanded to 13.62 per cent of the net sown area in the next decade. However the area started declining from 1990-91 onwards and dropped down to 3.39 per cent of the net sown area by 2012-13.
About six decades back pulses occupied a prominence in the cropping system of the State. In 1960-61, it was cultivated in an area of 44120 ha with a production of 17550 tons though the productivity was low ( 398 Kg/ha). By 2000-01, the pulse area in the State drastically declined to less than 1/6th of its area in 1960-61which amounts to 0.32 per cent of net sown area. By 2012-13, the pulse area in the State has dropped down to 0.14 per cent of the net sown area though there was definite productivity enhancement.
Data regarding the area, production and productivity of important crops grown in Kerala are shown below. Out of gross cropped area of 26.1lakh hectares in 2013-14, food crops comprising rice, pulses, tapioca occupy only 10.32 percent. In 2013-14, food crops in general showed an increasing trend in production as the production of rice as well as tapioca increased, while that of pulses recorded a marginal decline. This could be more account of increase in productivity than because of an increase in acreage as the area under rice has recorded only a marginal increase while that of tapioca has in fact declined. In the case of spices pepper showed a drastic fall in production mainly due to a productivity decline, while production of ginger and turmeric all showed a downward trend in production. In the case of plantation crops, coffee, tea and rubber have shown a decline in production while cardamom has shown an increase. With regard to fruits banana and other plantains as well as coconut recorded an increase in production because of an increase in acreage whereas the cashew output largely declined. Data regarding the area, production and productivity of important crops grown in Kerala 2013-14 is given here.
The data regarding the area, production and productivity of important crops grown in Kerala are shown below. In the gross cropped area of 26.24 lakh hectares in 2014-15, food crops comprising rice, pulses, tapioca occupy 10.5 per cent. In 2014-15, food crops in general showed an increasing trend in production as the production of pulses and tapioca recorded an increase of 13 and 18 percent respectively and that of rice recorded a marginal decline. This could be more on account of increase in acreage as the area under both pulses and tapioca has recorded an increase of 20 percent and 11.6 percent respectively. In the case of spices, pepper showed a tremendous increase in production (contrary to the previous year) mainly due to a productivity increase achieved, while production of ginger and turmeric showed an increasing trend in production (albeit marginally). In the case of plantation crops, coffee, tea and cardamom have shown increase in production while rubber has shown a drastic decline in production. Fruits, banana and other plantains recorded an increase in production whereas the cashew output largely declined. Data regarding the area, production and productivity of important crops grown in Kerala 2014-15 is given here.
Cropping pattern in Kerala is dominated by cash crops. Food crops comprising of rice, tapioca and pulses accounted for just 10.21 percent of the total cultivated area in 2015-16 while cash crops (cashew, rubber, pepper, coconut, cardamom, tea and coffee) constituted 62.8 percent of the total cultivated area. Plantation crops like rubber, coffee, tea and cardamom accounted for 26.8 percent of the total cultivated area. Coconut has the largest area under crop cover (30 per cent) followed by rubber (20.9 percent) and paddy (7.4 percent). Of the cultivated area, 4.45 percent is under banana and other plantains. Little more than 2 per cent is under tapioca and just 0.2 percent is under ginger and turmeric together. In 2015-16, pulses, pepper, ginger, areca nut, cardamom and rubber recorded slight increases in area under cultivation compared to the previous year while all other crops recorded a decline. The area, production and productivity of principal crops is given below:
Area, Production and Productivity of Principal Crops
Sl.No.
|
Crops
|
Area (Ha.)
|
Production (T)
|
Productivity (Kg./Ha.)
| |||
2014-15
|
2015-16
|
2014-15
|
2015-16
|
2014-15
|
2015-16
| ||
1
|
Rice
|
198159
|
196870
|
562092
|
549275
|
2837
|
2790
|
2
|
Pulses, including Tur
|
3601
|
3764
|
3409
|
4263
|
947
|
1133
|
3
|
Pepper
|
85431
|
85948
|
40690
|
42132
|
476
|
490
|
4
|
Ginger
|
4800
|
4986
|
22989
|
22044
|
4789
|
4421
|
5
|
Turmeric
|
2470
|
2603
|
6820
|
7112
|
2761
|
2732
|
6
|
Cardamom*
|
39730
|
39730
|
16000
|
19500
|
403
|
491
|
7
|
Areca nut
|
96686
|
99126
|
125926
|
132453
|
1302
|
1336
|
8
|
Banana
|
61936
|
59835
|
545431
|
536155
|
8806
|
8961
|
9
|
Other Plantains
|
56761
|
57683
|
468320
|
411626
|
8251
|
7136
|
10
|
Cashew nut
|
45436
|
43090
|
29715
|
24733
|
654
|
574
|
11
|
Tapioca
|
75493
|
69405
|
2943919
|
2662610
|
38996
|
38363
|
12
|
Coconut**
|
793856
|
790223
|
5947
|
5873
|
7491
|
7432
|
13
|
Coffee***
|
85359
|
84987
|
67700
|
69230
|
793
|
815
|
14
|
Tea $
|
30205
|
30205
|
65174
|
57898
|
2158
|
1917
|
15
|
Rubber #
|
549955
|
550840
|
507700
|
438630
|
923
|
796
|
Note: **Production of Coconut in Million Nuts, Productivity in numbers.
Source: Directorate of Economics and Statistics, # Rubber Board, *Spices Board. ***Coffee Board, $ Tea Board
Rice:
The area under rice has been declining consistently since the last three decades. Today rice occupies only third position in area under cultivation way behind rubber and coconut. And though last year the trend was reversed with a marginal increase in area and production, in 2014-15, it again showed a declining trend. Details regarding area, production and productivity of rice in Kerala is shown here. Area under rice has fallen in all the districts of the State in the period 1996-97 to 2012-13. However, the decline has been sharpest for Ernakulam (93%) followed by Kollam (92%), Thiruvananthapuram,(86%) and Malappuram (78%). On the positive side, in Kottayam and Alappuzha, the major rice growing districts the decline has been much less (13 and 12 percent respectively). In 2014-15, Kollam, Alappuzha and the northern districts of Kozhikode, Wayanad, Kannur and Kasaragod have shown decline in area as well as production in the State. In Kottayam, despite an increase in area of 9.8 percent the production has not responded positively. The details are [District-wise Area, Production and Productivity of Rice in Kerala 2012-15, District-wise and Season-wise Area, Production and Productivity of Rice for 2014-15 in Kerala]. The percentage change in area and production of rice in major districts of Kerala during 2014-15 over 2013-14 is given here.
Rice occupies 7.46 percent of the total cropped area of the state. However, the area under rice has been falling at an alarming rate ever since the 1980s. From 8.82 lakh hectare in 1974-75, the paddy area has come down to 1.96 lakh hectare in 2015-16. The production has also concomitantly declined from 13.76 lakh MT in 1972-73 (peak of production) to 5.49 lakh MT in 2015-16 is given here. Moreover, the productivity of the crop is very low in the State (2790 kg/ha), though it is higher than the national average (2424 kg/ha). The area, production and productivity of principal crops is given below:

Palakkad, Alappuzha, Thrissur and Kottayam account for about 81.2 percent of the total production of rice in the state, their individual shares being 41 percent, 16 percent, 14 percent and 9 percent respectively. In 2015-16, Alappuzha and Palakkad recorded a decline in production, while Thrissur and Kottayam recorded a slight increase in production. District-wise area under rice cultivation shows that area under rice fell for all the districts of the State between 1996-97 and 2012-13. However, the decline was sharpest for Ernakulam (93 per cent) followed by Kollam (92 per cent), Thiruvananthapuram (86 per cent) and Malappuram (78 per cent). On the positive side, in Kottayam and Alappuzha, the major rice growing districts, the decline was much less pronounced (13 and 12 per cent respectively). In 2015-16, Palakkad, Alappuzha and Wayanad, showed a decline in area as well as production of rice in the State details are given here. The diagrammatic representation is shown below:

Source: Directorate of Economics and Statistics, Govt. of Kerala
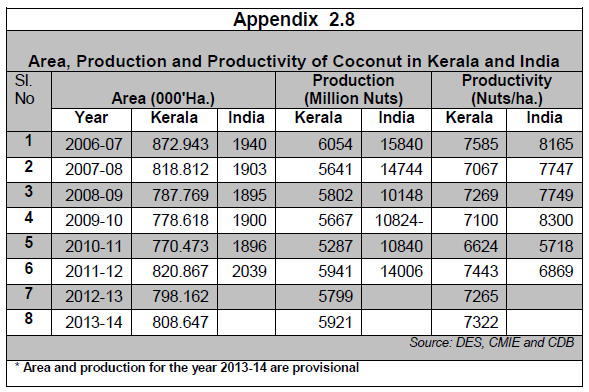
Coconut: In 2013-14, there was a marginal increase in the production from 5799 million nuts in 2012-13 to 5921 million nuts. Area, production and productivity of coconut in Kerala as well as India are given here
In 2014-15, there was a marginal increase in the production from 5921 million nuts in 2013-14 to 5947 million nuts. Area, production and productivity of coconut in Kerala are shown here. The main cause for falling productivity is the prevalence of root wilt disease, poor management and existence of senile and unproductive palms. Hence massive replanting of root wilt palms by elite palms and elimination of senile palms, setting up of nurseries for production of quality seedlings and their subsequent distribution is required for increasing productivity.
Between 2014-15 and 2015-16, there was a marginal decline in the production of coconut from 5947 million nuts to 5873 million nuts. Area, production and productivity of coconut in Kerala are shown below:

The main reason for the falling productivity of coconut is the prevalence of the root wilt disease, poor crop management and the existence of senile and unproductive palms. Hence, massive replanting of palms affected by root wilt with elite palms and elimination of senile palms, setting up of nurseries for production of quality seedlings and their subsequent distribution is essential for increasing productivity.
Pepper: Pepper production in the country recorded a decline from 55 thousand tonnes in 2012-13 to 45 thousand tonnes in 2013-14 It is reportedly due to a prolonged monsoon session resulting in adverse crop production. Concomitantly, pepper production recorded a decline in Kerala, from 46298 MT to 29408 MT in 2013-14. Fallling productivity could be the reason for falling output as there has not been much decline in the area under cultivation. Pepper production in the country recorded an increase of 25 thousand tonnes from 45 thousand tonnes in 2013-14 to 70 thousand tonnes in 2014-15. Concomitantly, pepper production in Kerala also recorded an increase, from 29408 MT to 40690 MT in 2014-15.
In 2015-16, pepper production recorded a decline to 55,000 tonnes from 70,000 tonnes in 2014-15. However, Kerala, which accounts for 75 percent of the total production in the country, recorded a slight increase in pepper production from 40.6 thousand tonnes in 2014-15 to 42.1 thousand tonnes in 2015-16.
Cashew: The production of raw cashew nuts increased from 728 thousand MT in 2012-13 to 736 thousand MT in 2013-14. The area under cashew cultivation also recorded an increase from 982 thousand hectares to 1006 thousand hectares in the respective years.Its alarming to note that the production which stood at 60 thousand MT in 2004-05 declined to 33.3 thousand MT in 2013-14 and to 29.71 thousand MT in 2014-15. While area dwindled from 81 thousand hectares to 49 thousand hectares and to 45 thousand hectares during the same period. Productivity of the crop which was around 900 kg per hectare during the late eighties also dwindled to 654 kg per hectare in 2014-15. Details are given here. Area and production are increasing steadily in other producing states in the country. Eventhough the major share of area under cashew is in Andhra Pradesh (18.3%), Maharashtra is the leading producer with 32.9 percent share in production during 2013-14 whose share was only 10 per cent in 1990-91.
In 2015-16, India continued to be the largest producer of raw cashew nuts in the world. The other main producing countries were Vietnam, Brazil, Tanzania and Ivory Coast. In Kerala, in the last one decade, there has been a continuous and considerable decline in both area under cultivation as well as production of cashew. It is alarming to note that the production, which stood at 60 thousand MT in 2004-05, declined to 33.3 thousand MT in 2013-14 and to 24.73 thousand MT in 2015-16. The area under cultivation dwindled from 81,000 hectares to 49,000 hectares and to 43,000 hectares during the same period. The productivity of cashew, which was around 900 kg per hectare during the late eighties, also fell to 654 kg per hectare in 2014-15. Details are given below:

Rubber:India produced only 8.44 lakh tonnes of natural rubber (NR) during the year 2013-14, significantly lower by 69.7 thousand tonnes from 9.13 lakh tonnes in the previous year. The severe summer in Kerala during April and May 2013, interruption of tapping caused by unusually continuous monsoon and loss in yield due to leaf diseases contributed to the severe fall in production. Moreover, low rubber prices and high wages have compelled small holders to reduce application of inputs and adoption of recommended farm management practices. Consequently, the average yield measured in terms of production per hectare of yielding area declined during the year to 1629 kg from the previous year 1813 kg. Although yielding area expanded during the year by 14000 ha it could not fully offset the decline in production resulted from the low average yield. The consumption of natural rubber though sluggish was higher than previous year. As a result India imported 325.2 thousand tonnes of natural rubber during 2013-14 significantly higher than 217.4 thousand tonnes in the previous year. It was not different in Kerala also, as the total production dwindled from 798940 MT in 2012-13 to 648220 MT in 2013-14 despite an increase in area of 1.6 per cent in 2013-14.India produced only 6.45 lakh tonnes of natural rubber (NR) during the year 2014-15, significantly lower by 1.2 lakh tonnes from the previous year. Another major development during the year was the downward revision of production figure by the Rubber Board for the year 2013-14 to 7.74 lakh tonnes in the place of 8.44 lakh tonnes. The production scene was no different in Kerala also, as the total production dwindled from 6,48,220 MT in 2013-14 to 5,07,700 MT in 2015 despite a marginal increase in area of 0.3 percent in 2014-15. The details are given here[Import of Rubber (1993-94 to 2014-15) , Price Trend of Rubber ].
Production of Natural Rubber (NR) in India declined by 12.9 per cent from 6.45 lakh tones in 2014-15 to 5.62 lakh tonnes in 2015-16. Even though tappable area under natural rubber was 5.59 lakh ha during 2015-16, only 3.91 lakh ha of area contributed to the NR production during the year. Consequently, the average yield, measured in terms of production per hectare of tapped area, declined to 1437 kg/ha in 2015-16 as compared to 1443 kg/ha the previous year. During 2016-17, the production is estimated to be 6.54 lakh tonnes of NR. The Import of Rubber (1994-95 to 2015-16) Details are given below:

Coffee:Domestic coffee production for the year 2013-14 was estimated at 304.5 thousand tonnes which represents a decline of 13.7 thousand tonnes compared to the previous year. The long period of drought followed by extremely harsh monsoon coupled by the onslaught of White Stem Borer (WSB ) disease led to this drastic decline in the crop.Domestic coffee production for the year 2014-15 was estimated at 327 thousand tonnes which represents an increase of 22.5 thousand tonnes compared to the previous year. With regard to Kerala the production of coffee registered a slight increase from 66,645 MT in 2013-14 to 67,700 MT in 2014-15. The share of Kerala in total coffee production in the country is around 20 per cent during the year.
Domestic coffee production for the year 2015-16 was estimated at 348,000 tonnes, which represents an increase of 21,000 tonnes compared to previous year. In the case of Kerala, the production of coffee registered a slight increase from 67,700 MT in 2014-15 to 69,230 MT in 2015-16. The share of Kerala in total coffee production in the country is around 20 per cent during the year. Major variety grown in Kerala is Robusta with a share of 97.1 per cent in planted area. Productivity of the crop in terms of bearing area in Kerala is 808 kg/ha, which is lower than the national level of 852 kg/ha during 2011-12. Among the States, Kerala stands next to Karnataka which produces 70.4 percent of total Indian coffee production.
Tea: In 2014-15, tea production has increased by 3.5 percent mainly on account of increase in productivity as area under tea has mostly been stagnant as compared to previous year. The details are shown here.
Kerala accounts for 5.03 per cent of the area and 6.3 percent of the total domestic production of tea in the country. The production of tea in the State has been consistently falling since 2009-10. There was a slight improvement in 2012-13 as tea production recorded an increase of 5059 MT despite a decline in area of 18 per cent. This increase in production was mainly on account of increase in productivity. Tea production recorded an increase of 3.5 per cent in 2014-15 also but in 2015-16 there was a decline in production by 11.16 percent. The major issues affecting the tea industry are stagnant productivity, acute labour shortage, high cost of machines, and lack of indigenous machinery. Details are given below:

Cardomom: India is the second largest producer of small cardamom and plays an important role in the international trade of cardamom. Cardamom production in the country during 2013-14 was estimated at 14.5 thousand tonnes compared to 14 thousand tonnes in 2012-13, an increase of 500 tonnes.Cardamom prices has dropped during 2013-14 to 692.54 per kg. As a result the exports recorded a drastic decline of 52 percent in 2013-14. During 2014-15 period, cardamom production has increased by 14.2 percent in despite the area under cultivation remaining stagnant.
India is the second largest producer of small cardamom and plays an important role in the international trade of cardamom. The output of cardamom is dependent on prevailing climatic conditions as the cardamom plant requires intermittent spells of rains and good sunshine during the growth stage. Cardamom production in the country during 2015-16 was estimated at 22 thousand tonnes compared to 18 thousand tonnes in 2014-15, an increase of 4 thousand tonnes. The turnaround in cardamom prices since 2006-07 continued up to 2010-11 reaching the highest level, but thereafter the prices have fluctuated. During 2015-16 (August-June), the prices increased by 107.33 per kg to reach 754.00 per kg. Meanwhile in Kerala, cardamom production has increased by 21.8 per cent in 2015-16 despite the area under cultivation remaining stagnant.
Collective Farming throght Kudumbasree: Collective farming is an important area of Kudumbashree which aims at food security both at household and community level. The major crops cultivated are paddy, vegetables, banana, pineapple and tubers. In 2013-14 area brought under cultivation of paddy was 15078.60 ha, vegetables contributed 12555.60 ha and 22476.20 ha of area was covered by other crops (banana, pineapple and tubers). The details are given here.
Source:
(1)Economic Review 2010-2016
(2)Directorate of Fisheries
(3) Livestock census report/animal husbandry department
(4) Directorate of Economics and Statistics
.png) |  |  |  |  | .JPG) |
No comments:
Post a Comment